II. Nile River Study
You have probably seen many rivers in your lifetime—long, lazy rivers; rapids rushing through gorges; rivers with many branches; steep or flat rivers.
What influences the direction and course of a river? What makes it flow? In this investigation you will explore how the path of the Nile River system relates to the surrounding land.
Part A. Predict
If you stand on the banks of the Nile in Cairo, you see a river that is wide and flat. But what path did water follow to get to this point? What shape did it take along the way? To what extent did the landscape influence its journey? To gain insight into these questions, begin with a prediction.


Look at the the Elevation Map or the PowerPoint of the Nile River area. The Nile River is not shown on the elevation map, but when you look at the map, there are places where you can see the path of the river. In other areas, its route is not as clear.
Predict the river's path: Where does the river flow, and why does it follow that path? Begin thinking about the relationship between topography and the river by sketching your predicted river path on a color printout of the map, or on a piece of acetate placed over the screen image, or by using the drawing tools in PowerPoint. Annotate your sketch with explanations in at least three locations.
Part B. Stream Table
Your stream table can shed light on the physical interactions between land and water. How does topography affect where the river flows? How does the river affect the land around it? To find out, you have to get your hands dirty!
Use your stream table to model some of the processes at work in the formation and flow of a river. Your whole "river," from source to sea, will only be twenty inches long! See what happens when water and "land" interact. In a mere thirty minutes you will observe the formation of a river, a process that could take 30,000 years.
Follow the Stream Table Set Up to prepare your stream table. Then model and compare the following scenarios:
- Flat terrain, inclined plain
- A landscape with hills and valleys
Stream Table Scenarios
|
|
1. Flat terrain, inclined plane
- Use the standard stream table setup as described in the stream table setup instructions and create a smooth, flat soil surface.
- Elevate the upstream end of the river about 1.25 inches.
- Start the river, letting the water pour onto the soil in a steady, fast drip.
- Let the river form for 30 minutes.
- Record observations in your journal at 10-minute intervals; include annotated sketches.
|
|
2. Landscape with hills and valleys
- Remold the soil in the stream table; create a soil surface with several hills and valleys.
- Elevate the upstream end of the river about 1.25 inches.
- Start the river, letting the water pour onto the soil in a steady, fast drip.
- Let the river form for 30 minutes.
- Record observations in your journal at 10-minute intervals; include annotated sketches.
|
|
Stream Table Troubleshooting
Topics covered:
- Soil is as hard as a rock
- Soggy soil
- Gravel is mixed into the soil
- No water coming out of the downstream valve
Warning! Don't pour soil down your drain.
We strongly recommend using a bucket to catch the water
|
Use sketches and words to record your experience in your journal. Pay particular attention to the movement of both soil and water.
What similarities, differences, and patterns do you notice in the two scenarios?
SeeWhat is a Watershed? to help you identify different parts of the river system.
After you've modeled and documented the two scenarios, consider the following questions:
- How did the river shape the landscape? What landforms did it create? What landforms did it erode?
- How did the landscape influence the river's course?
- How does this evidence influence your ideas about the course of the Nile?
Record your analysis in your journal. You'll refer to this journal record for your report.
Part C. Elevation Map
A close look at elevation changes along the route of the Nile sheds more light on the relations between topography and river flow.
| |
Google Earth Tips
Conduct your Google Earth investigation on the computer. Printing out maps is awkard and time consuming.
If you are unable to run Google Earth, email Mr. Keser. Then continue the assignment, skipping to the Elevation Data Table and working with the exact elevation values given there and with your map.
|
| |
Google Earth will provide you with data for making an elevation map and for recording in an elevation data table. As you work, consider how the different representations aid or limit your interpretation of the data and inform your understanding of the Nile.
Studying Elevation Changes with Google Earth
Creating an Elevation Map Using Google Earth
To become familiar with Google Earth,see the instructions for Measuring Distance with Google Earth
Use Google Earth to create an elevation map of the Nile region. Use the "Fly to" feature to travel to specific locations or consult the latitude and longitude data recorded in session 1 on your Nile Data Sheet. Read the numerical elevation values as you travel along the length of the Nile.
Add your elevation map to your journal
Elevation Data Table
Return to the Nile River Data Sheet you put in your journal in Session 1. Use Google Earth to collect elevation values at the specific locations on the data sheet. Record the numerical elevation values (and latitude and longitude coordinates).
You can use the scale on the Michelin map of Northeast Africa to get a sense of the magnitude of the elevation compared to the overall length of the river. Record the elevation at the different locations right on your map.
Take a look at Exact Elevation Values for the same locations. What do you think accounts for the differences in the values?
Creating an Elevation Graph Using Fathom
Use the data on your Nile River Data Sheet to make a line plot. Use the vertical axis for elevation and the horizontal axis for distance from the Mediterranean Sea.
Use Excel to make your graph of Nile Elevation vs. Distance from the Mediterranean Sea. Your graph will contain two plots:
- The Nile River from the Mediterranean to the Blue Nile to Lake Tana
- The Nile River from the Mediterranean to the White Nile to Lake Victoria
Add your graph to your journal. (Don't be fooled by the scale on the graph. Remember, the elevations are in meters, the distances are in kilometers.)
How does land elevation affect the river? Use your Google Earth map, your data table and your graph to analyze the Nile elevation data. Use evidence from the data to support any assertions you make.
The following questions can help you record your analysis in your journal.
- What and where are the maximum values?
- How rapidly do the elevations change?
- Describe the patterns you see; are there trends or correlations?
- How do the White Nile and the Blue Nile compare?
- How does this quantitative data shed light on your prediction in Part A?
Earth scientists use a variety of representations to gain more insight into quantitative data. For instance you have viewed elevation data in tabular form, mapped, and graphed. How do the different representations reinforce your explanation of why the Nile flows where it does? What insights into this question does each representation give you? What are the limits of each representation?
Part D. The Nile watershed
In the last part of your investigation you use elevation data to determine the scope of the Nile's watershed.
Imagine a heavy rainfall in Northeast Africa. Will the rainwater in Addis Adaba, Ethiopia, reach the Nile? What about the rainwater in Nairobi, Kenya or in Nyala, Sudan? Would rainwater there reach the Nile? In your journal, write down your speculations and your reasons for them.
Rainwater that is not absorbed and stored by the soil runs downhill on the ground surface and through the soil as groundwater to streams that lead into small rivers that eventually join larger rivers. All water inevitably flows downward, and all of the land that leads water downward to a specific river is called that river's watershed or drainage basin.
"The ridges that separate the land draining into one river from the land draining into another river are called the watershed divide. The most famous example of a watershed divide in the United States is the Continental Divide. All of the water on the east of the Continental Divide and west of the Appalachian Mountains eventually flows to rivers leading to the Gulf of Mexico."
Similarly, the ridges surrounding the Nile and all its tributaries define the Nile watershed. From what points do you think water will flow into the Nile and at what points do you think it will flow away?
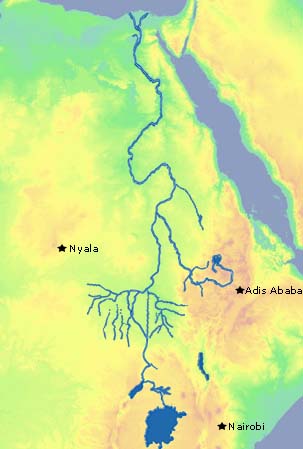
Study this Elevation Map Showing the Nile and Its Tributaries (this PowerPoint file will download). Then spend ten minutes drawing what you think is the boundary of the Nile watershed. This isn't easy! See the instructions on the Elevation Map for guidance.
Spend some time examining the river and the watershed area on your Michelin map. Record your observations about the watershed in your journal. As the river moves downstream, what do you notice about:
- The number of tributaries
- The length of the tributaries
- The width of the stream channel
- The size of the river valley
Step back and look at the entire watershed.
- What area does the watershed include?
- How does the land influence the path of the river?
|
Comments (0)
You don't have permission to comment on this page.